
You've finished for the day, you look at the agenda and see unexpected gaps, last-minute cancellations and, to top it off, that new event you launched has barely had any bookings.
Then you think, "What happened, is it the schedule? The type of service? Was it too many steps to book?"
The information is there... but without a proper tool, it's hard to interpret it and improve.
According to a McKinsey study, organizations that adopt advanced analytics tools can achieve substantial improvements in productivity and decision making, as well as a positive impact on the customer experience. In the context of appointments, this means less wasted time, more effective bookings and decisions based on real data.
That's why we created TuCalendi Analytics: to help you see what others don't see in their schedule... and use it to your advantage. Because if you can't measure it, you can't improve it. And if you can measure it, you can grow smarter.
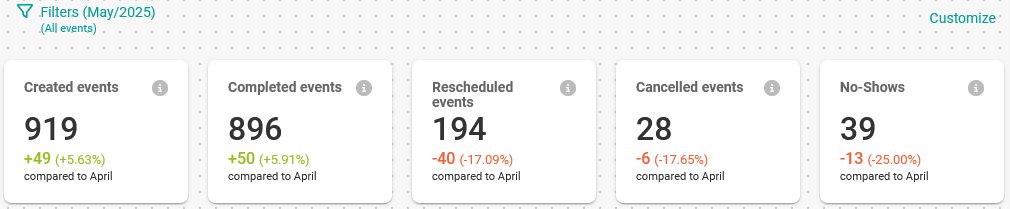
With the TuCalendi Analytics dashboard overview, you can see an overview of the number of bookings created, successful bookings, rescheduled appointments, cancellations and no-shows, all in one place. Ideal to have a clear view of how your activity evolves in a month.
All the graphs you will see in this article are taken directly from TuCalendi Analytics, with its original design and corporate colors. This feature is included in the Pro Plan and is automatically activated when you upgrade to the Pro Plan.
What is TuCalendi Analytics and why should you pay attention to it?
Service providers have always sought to improve with every appointment: to listen better, to adjust times, to understand the customer. The difference is that now you don't have to rely on intuition alone: the data shows you clearly.
That's where TuCalendi Analytics comes in. It's not just a screen with numbers. It's a tool designed to help you make decisions that optimize your schedule, improve the customer experience and, yes, increase your revenue.
What can you see?
-
What days and times your customers prefer.
-
Which services are booked the most... and which are booked the least.
-
How many appointments are cancelled or no-shows.
-
How your booking volume evolves throughout the month.
And the best part: everything is designed for you to understand at a glance. Because if you can't understand something quickly, you won't use it.
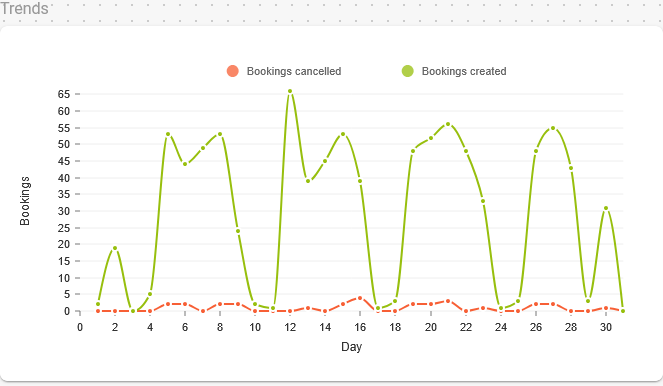
Below is a graph showing the daily evolution of bookings and cancellations over the last month, allowing you to identify the busiest and slowest days.
2. From data to action: how to use information to make better decisions
Knowing how many appointments you have is fine. Knowing why they went down this week and what you can do about it is strategic.
With TuCalendi Analytics, you can leave the guesswork behind and accurately answer questions like:
-
What is the most booked service in the mornings?
-
At what times are there more cancellations?
-
How many new customers do I have this month and from which channel did they arrive?
-
Which professional or resource is most in demand?
With this data, you can:
-
Rearrange your availability to leverage peak demand times.
-
Identify services that are not working and rethink or promote them better.
-
Adjust the duration of your appointments or implement buffers if you detect regular delays.
-
Make business decisions with confidence, not just intuition.
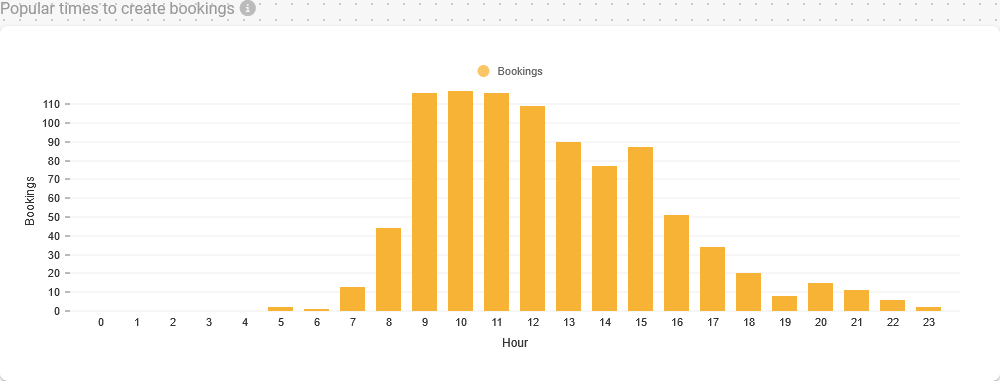
Below, this chart allows you to identify peak and off-peak times, spot trends and plan your availability more accurately.
As this article on how to set the optimal length of your appointments shows, understanding your booking patterns is the first step to better manage your schedule and avoid bottlenecks.
3. Customer experience is also designed with data
It may seem paradoxical, but the more you use data, the more human your service becomes. Why? Because you better understand your customers, their habits, their preferences and what they expect from you.
Imagine this:
-
You know your customers tend to book more on Tuesday afternoons. So you open more availability in that time slot.
-
You detect that one service has more cancellations than others. You decide to adjust the reminder text or improve the message on the booking page.
-
You notice that a customer always books on the same day, but has recently stopped doing so. You can contact him with a personalized message and recover the relationship.
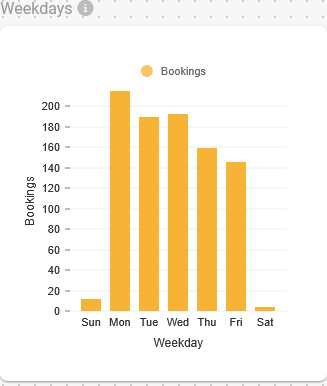
The graph below shows the accumulated activity of the days of the week over a period, so you can quickly see the days with more or less activity.
With TuCalendi Analytics you are improving without interrupting, and you are personalizing without guessing. Every decision you make based on data reduces friction, anticipates needs and improves the perception of your service.
4. A clear interface for quick decisions
What's the point of having data if you need to be an analyst to understand it? With that in mind, we designed TuCalendi Analytics with a clear approach: visual, intuitive and useful.
In a single dashboard you can:
-
Consult the total number of bookings for the month (past and future).
-
View a graph with the daily evolution of bookings.
-
Identify how many have been confirmed, cancelled or not attended.
-
Analyze behavior by service, by type of event or even by agent (if you work in a team).
And all with customizable filters by:
-
Date
-
Type of service
-
Booking source (web, social networks, embedded, etc.)
-
Agent or calendar
This not only allows you to understand what is happening, but to compare periods and detect trends.
If you want to see an example in action, you can check out the full TuCalendi Analytics tutorial and start taking advantage of it today.
![]()
Use case: how an academy reduced its cancellations by 40%.
Laura runs a small language school with three teachers. During the first quarter, she noticed a lot of absences and empty schedules... but she didn't know why.
She activated TuCalendi Analytics and in less than a week she discovered something revealing:
-
Cancellations were concentrated on Mondays at 9:00.
-
New students preferred to book from Instagram.
-
The "Trial Class" service had a 35% non-attendance rate.
What did Laura do?
- She closed the conflicting schedule on Mondays.
- She changed the booking link on Instagram to a clearer dedicated page.
- She added a special reminder message just for trial classes.
The result?
It reduced no-shows by 40% and gained 7 new students that month. All, thanks to the data.
Bottom line: when data speaks, business moves forward.
In the day-to-day running of any service business, quick decisions are necessary... but smart decisions make all the difference.
TuCalendi Analytics is not just a tool for looking at numbers: It's a window into what's really going on in your schedule. It's your ally to avoid bottlenecks, improve customer experience and make decisions based on facts, not assumptions.
The key is to look at the numbers and act. Because, as you've seen, even small adjustments can translate into more punctuality, more efficiency and more revenue.
Ready to make decisions with real data?
Find out how TuCalendi Analytics can help you optimize your schedules, reduce cancellations and improve your customers' experience.
Book a live demo and see how it works, step by step. Click here and schedule your personalized demo.