In TuCalendi Analytics you will find data, metrics and trends of the assigned bookings of your team members. This way, you can visually see what is happening with the meetings assigned to the different members of your team and measure productivity.
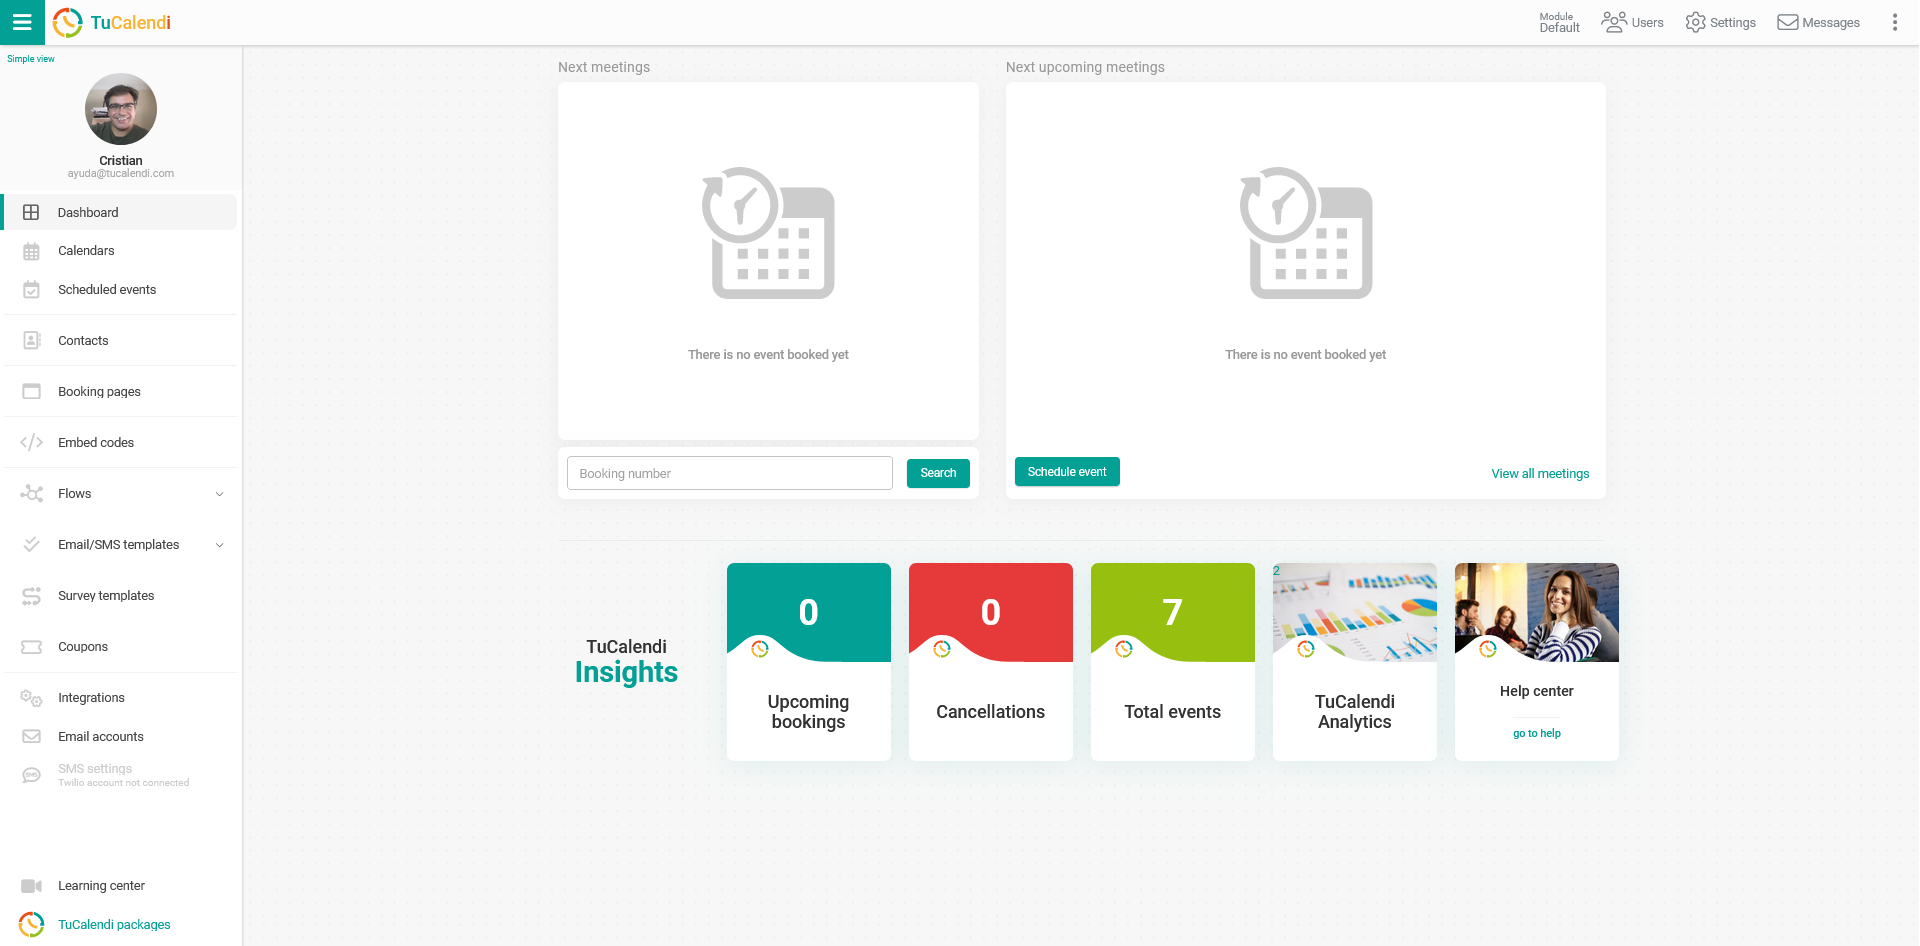
Log in to TuCalendi with your username and password. In the Dashboard you will find direct access to TuCalendi Analytics:
NOTE: To access TuCalendi Analytics you need to subscribe to the Pro Plan.
In the "TuCalendi Insights" section, click on the "TuCalendi Analytics" option.
Let's see what user information is displayed in each block of the TuCalendi Analytics dashboard, how to customize the dashboard and how to set filters.
Bookings received for users and more created
- Created events for users: Bookings received and assigned to the users of your team on each day of the selected month.
- More created: Number of bookings assigned to each team member in the selected month.
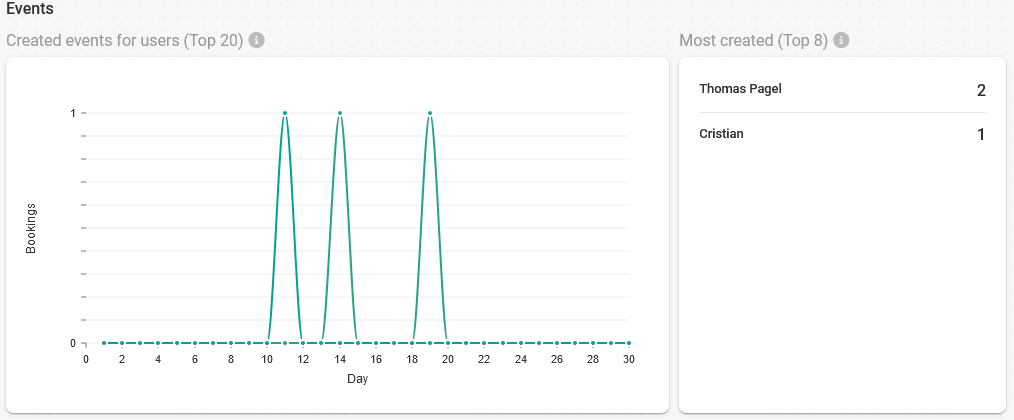
Moving the mouse over the graphs displays the numerical value.
Completed meetings
- Completed meetings by users: Meetings that have been completed by users on each day of the selected month.
- Most completed: Number of meetings that have been completed by each team member in the selected month.
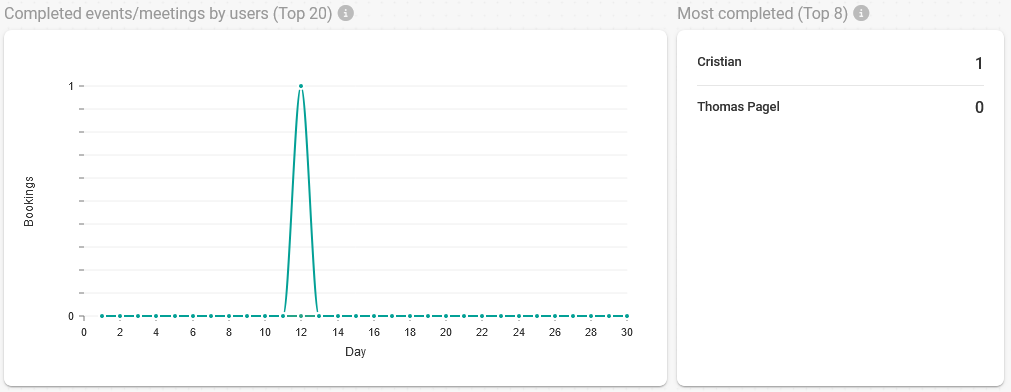
Completed bookings are meetings that have ended and have been completed by you or any member of your team.
Durations and most time spent
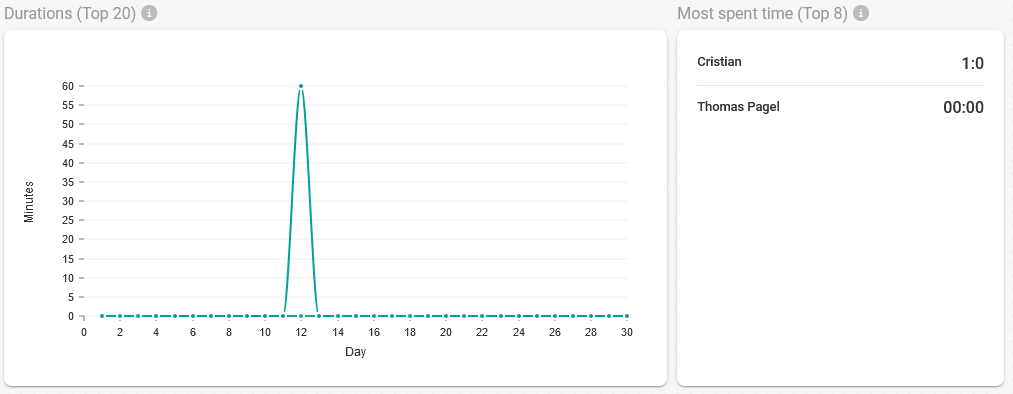
- Durations: Time in minutes of meetings completed each day in the selected month.
- Most spent time: Time in hours and minutes of meetings that have been completed by each user of the team in the selected month.
Customization
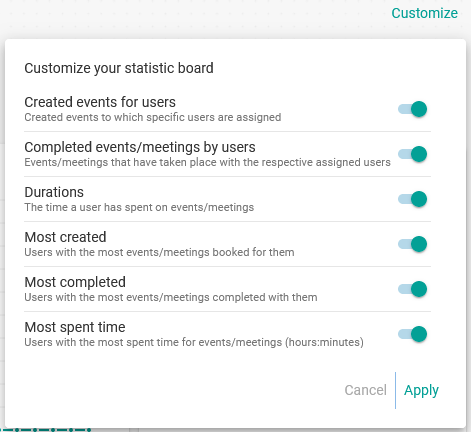
With the "Customize" option you can activate or deactivate blocks to show only the user statistics that are important to you.
Filters
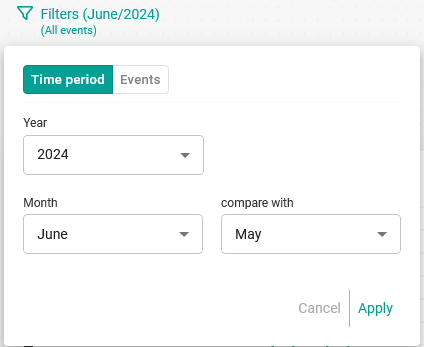
Using the options under "Filters" you can set a "Filter by period" to choose the month you want to analyze and also the month to compare with:
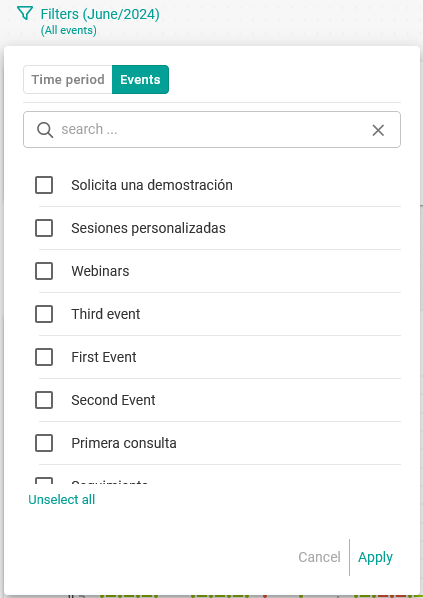
In addition, you can set the "Filter by events" by selecting the events you want to be displayed in the statistics: