
In this tutorial we explain how to interpret the general booking data and what each metric means.
Log in to TuCalendi with your username and password. In the "Dashboard" you will find the shortcut:
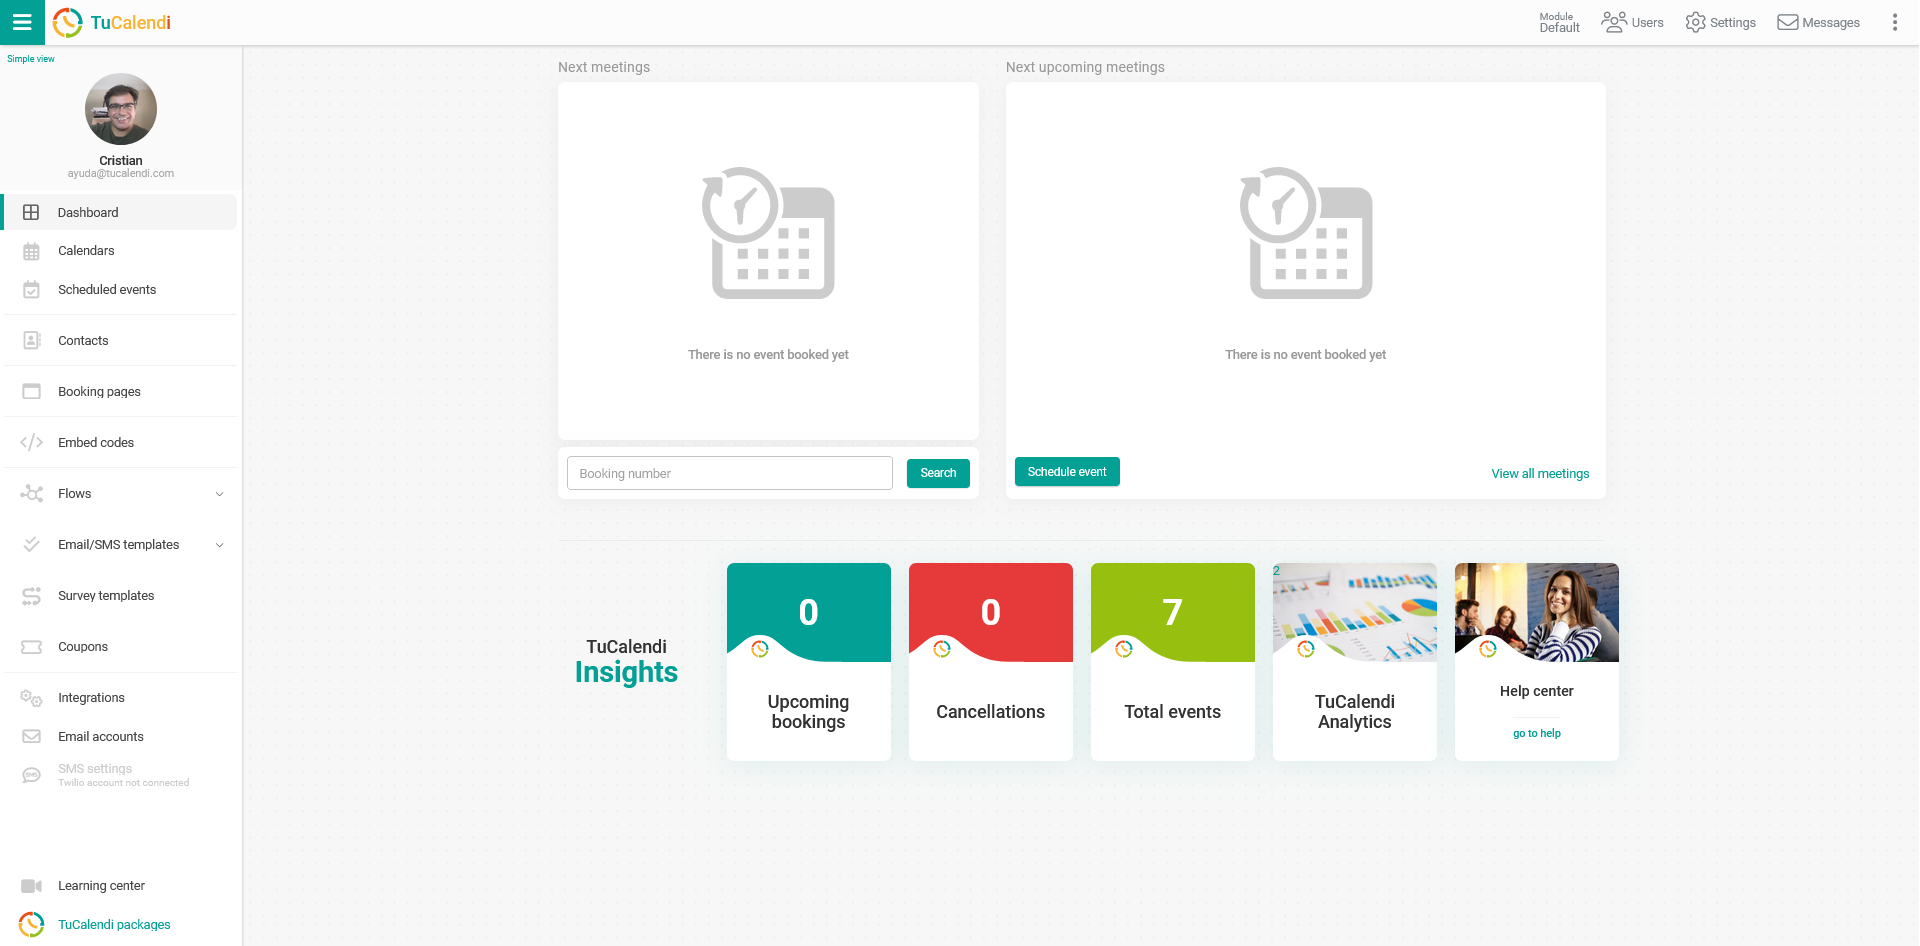
In the "TuCalendi Insights" section, click on the "TuCalendi Analytics" option.
The first boxes of the statistics dashboard show the overall booking data of the current month compared to the previous month.

The information in each box refers to the monthly activity and the variation compared to the month you are comparing it with.
- Created events. Total number of bookings received in the selected period.
- Completed events. Number of appointments or meetings completed by you or your team in the selected period.
- Rescheduled events. Number of meetings rescheduled manually or by the client from the confirmation email in the selected period.
- Canceled events. Number of meetings canceled manually or by the client from the confirmation email in the selected period.
- In the comparison you can see the percentage growth of each parameter. The growth can be positive or negative.
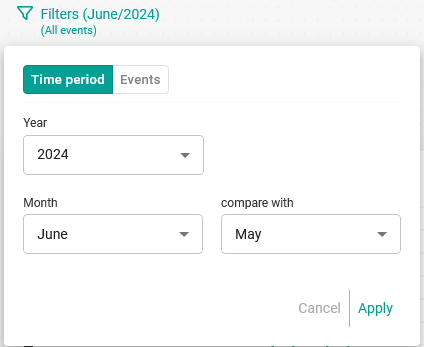
Note that with the options under "Filters" you can change the month you want to analyze and also the month to compare with:
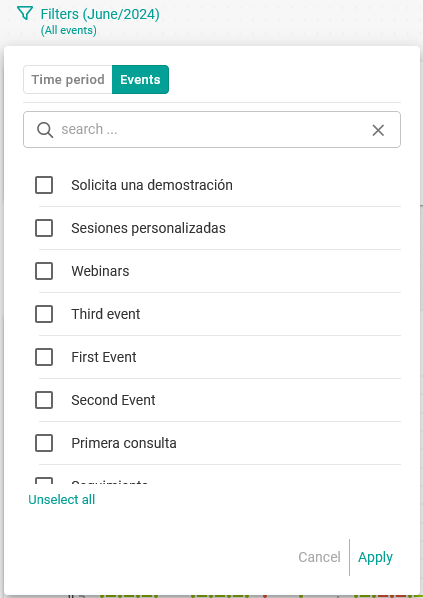
You can also filter by the events you want:
With these metrics you can see if the activity of your business has increased, decreased or remained unchanged.